
Right stock, right location, before it becomes urgent.
Stock accumulates in Manchester while orders arrive from London. This monitors days of cover at every location and generates the transfer before the shortage turns into expedited freight.
What it costs you now
-
Emergency transfers and premium freight.
The cost lands across two different codes — logistics and shipping — which is why most operators have never totalled it.
-
Sales lost in transit.
The window while stock moves between sites is a window in which the product is not available anywhere.
-
Coordination labour.
Four to six hours weekly spent cross-referencing spreadsheets and chasing 3PLs, work that produces nothing except the absence of a problem.
How it works
-
Unified position
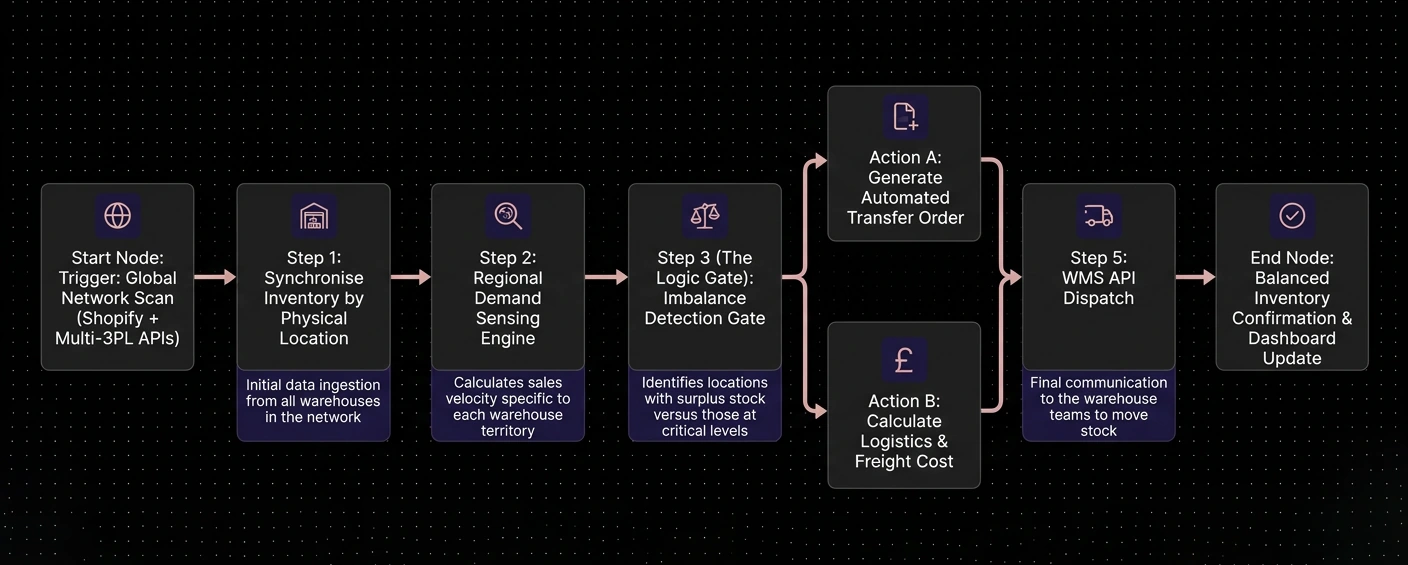
The system queries every warehouse and 3PL simultaneously to produce one view of each SKU across the network.
-
Regional demand sensing
It compares local demand against local stock, so a territory running short is identified even when global stock looks healthy.
-
Imbalance detection
Where one location holds surplus — above forty days of cover — and another is critical, below ten, a transfer is proposed for that SKU.
-
Cost gating
Your freight rates are built into the logic, so a transfer is only proposed where the cost of moving is lower than the cost of not moving.
-
Dispatch
The system prepares the transfer against your 3PL's API and notifies the warehouse teams. Your team gives the final approval; it does not move stock unattended.
What it is worth
We model around £3,200 a month for a store with two locations.
The assumptions: twelve emergency transfers monthly at £180 each, plus 240 orders shipping from a sub-optimal location at a £4.50 premium. Sales lost during transit are deliberately excluded, because that figure varies too widely between stores to model responsibly without your data.
Commercials
- Implementation from £4,500 · Retainer from £500 monthly, twelve months then rolling
- Live in three to four weeks — longer than the single-system solutions because every 3PL integrates differently
- Typical payback: three to six months against total first-year cost
Suited to stores with two or more locations or 3PL relationships.
How the engagement runs
-
 Diagnosis
We map your locations, your 3PL capabilities, and your historical regional demand.
-
 Scope
Scope
We set the days-of-cover triggers per product category and input your freight rates.
-
 Build
Build
We construct the bridges between each warehouse system and Shopify.
-
 Handover
A monitoring layer so your team can see every proposed transfer and the freight cost it avoided.
Questions
Will it move stock automatically?
No. It generates the transfer order; your team or your 3PL gives the final approval. We consider unattended stock movement an unnecessary risk.
Does it work internationally?
Yes, across UK, EU and US locations. Customs and duty implications are surfaced rather than automated.
How does it account for transfer cost?
Your freight rates are inputs to the logic, so a transfer is only proposed where it is economically worthwhile.
Does it work with Amazon FBA?
Yes. It can monitor FBA positions alongside your 3PL stock.
Does it account for regional demand differences?
Yes. Thresholds adjust where one territory consistently sells faster than another.
Does it require a particular warehouse system?
No. We build bridges to any system offering an API or structured export.
Can it handle bundles and kits?
Yes, tracking component stock across locations.
What about warehouse capacity limits?
Capacity rules are respected. The system will not propose a transfer into a location that cannot receive it.
Establish the figure for your store
The Operational Health Scorecard returns a modelled leakage figure in about four minutes.
No call required.
Take the Operational Health Scorecard