
Purchase orders built from data, not from a spreadsheet review.
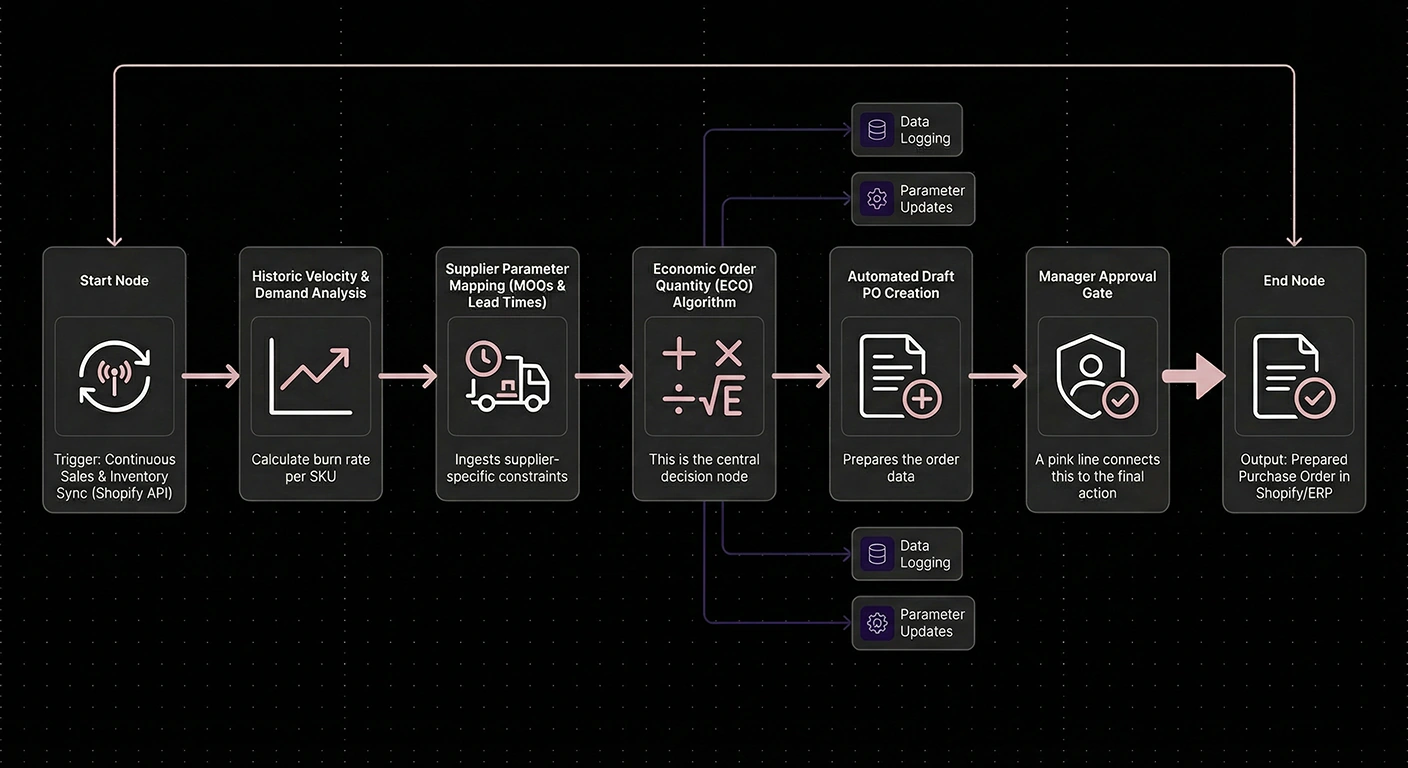
Reorder decisions made fortnightly in Excel produce a predictable pattern: capital tied up in slow lines while fast movers stock out. This calculates reorder points continuously and prepares the order for approval.
What it costs you now
-
Capital in the wrong inventory.
Slow-moving stock absorbs working capital, storage and insurance while the lines that sell run short.
-
Stockouts on fast movers.
The products that fund the business are the ones most likely to be under-ordered, because velocity changes faster than the review cycle.
-
Buyer time and exposure to error.
Six to eight hours a week in spreadsheets, making decisions worth six figures with a formula nobody has audited in two years.
How it works
-
Velocity tracking
SKU-level demand is monitored continuously, accounting for seasonality, historical patterns and any promotion you have scheduled.
-
Supplier profiles
Lead times, minimum order quantities and tiered pricing are held per supplier and applied to every calculation. Lead-time variance is tracked, so a supplier who routinely runs late is treated as such.
-
Reorder calculation
The system balances the cost of holding stock against the cost of running out, and rounds to the nearest workable order quantity.
-
Stock in transit
Open purchase orders are counted, so you do not reorder against inventory already on the water.
-
Draft generation
A prepared purchase order is pushed to Shopify or your ERP with the reasoning attached. Your buyer approves it. Nothing is ordered automatically.
What it is worth
Two components.
Holding cost on excess inventory: around £10,000 a year. Assuming £180,000 of excess stock, an annual holding cost of 22% covering capital, storage, insurance and obsolescence, and a 25% reduction in that excess.
Avoided stockouts on fast-moving lines: around £2,700 a month. Assuming four stockout events monthly, each shortened by a day and a half, on products contributing £450 daily.
Commercials
- Implementation from £5,500 · Retainer from £600 monthly, twelve months then rolling
- Live in three to four weeks
- Typical payback: four to twelve months against total first-year cost
Suited to stores with 150 or more SKUs across multiple suppliers.
How the engagement runs
-
 Diagnosis
We analyse your supplier history and SKU velocity to identify where capital is currently misallocated.
-
 Scope
Scope
We record your supplier terms, MOQs, lead times and shipping constraints.
-
 Build
Build
We construct the reorder logic against live Shopify data.
-
 Handover
We establish the approval workflow, so your buyer reviews and authorises each draft rather than discovering orders after the fact.
Questions
Does it order anything automatically?
No. It prepares the order. A person approves it. We have not encountered a merchant who wanted it otherwise.
Does it handle different lead times per supplier?
Yes, including historical variance — a supplier who quotes fourteen days and delivers in twenty is modelled at twenty.
Does it respect minimum order quantities?
Yes. Quantities round to the nearest MOQ or case size.
How does it handle seasonal spikes?
Promotional and seasonal factors can be applied to inflate forecast demand for defined periods.
Does it integrate with our ERP?
Yes — Brightpearl, Linnworks, NetSuite and others with an available API.
Can it choose between suppliers carrying the same SKU?
Yes, prioritising on cost or lead time according to your preference.
Can we see the reasoning behind a recommendation?
Yes. Every draft carries the calculation that produced it. A recommendation your buyer cannot interrogate is one they will not trust.
How does this compare with Stocky?
Stocky applies a general model. This applies yours — your supplier variance, your seasonality, your promotional calendar, and your definition of acceptable stockout risk. If Stocky is producing orders your buyer already trusts, we would tell you to keep it.
Who is this not for?
Stores with a small catalogue and one or two suppliers, where a spreadsheet is genuinely adequate.
Establish the figure for your store
The Operational Health Scorecard returns a modelled leakage figure in about four minutes.
No call required.
Take the Operational Health Scorecard